Four tools from the Drift framework
A calculator that prices any recurring meeting, an interactive delivery board for a scaled programme, a guided week-by-week replay of one PI, and the book's five-question Drift Check, which you can take in your browser, run in your terminal, or print. They all grow out of the Drift framework in my book, Leading Agile When No One Agrees.
Meeting Cost Calculator
Put a number on any recurring meeting or agile ceremony. Pick a ceremony, set who is in the room and how often it runs, and watch the yearly cost add up, with the maths shown and a branded PDF to share.
Run the numbers ↓ Interactive demoE/E Solution Tracker
A live delivery board for a scaled automotive programme. Switch four lenses to see where work drifts, scrub the timeline across a Program Increment, or load your own board.
See the board ↓ Concept prototypeDriftBoard Next
The tracker reimagined: a drift ribbon you scrub, lenses that morph the board, a one-tap scan that diagnoses itself, and a presenter mode for talks.
See it ↓ Guided replayPI Replay
One PI over twelve weeks, narrated step by step on a DriftBoard: two side doors, one corridor replan, and the gap they leave behind.
See the replay ↓ Self-assessmentThe Drift Check
The book's five-question diagnostic, scored in your browser. Rate five statements and get your Drift reading, with nothing stored or sent. Also a printable worksheet and a terminal tool.
Take the check ↓Meeting Cost Calculator
Most recurring meetings are never priced. This one puts a number on them.
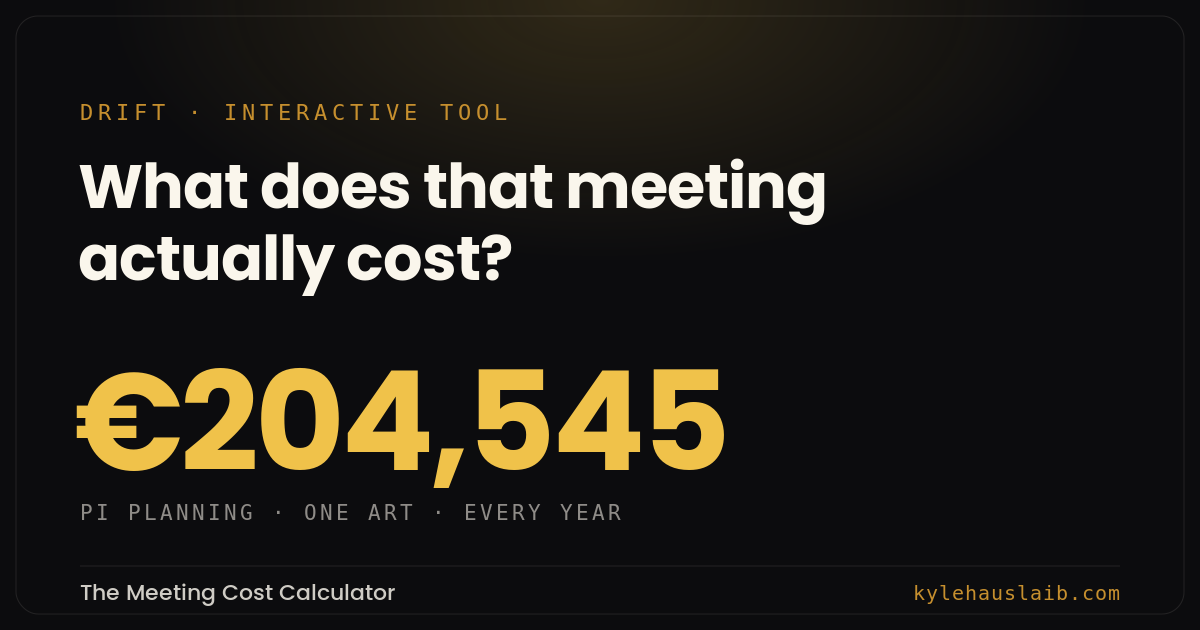
What does that meeting actually cost?
Pick an agile ceremony or any recurring meeting, set the attendees, duration, frequency and a fully-loaded cost per person, and the yearly figure builds in front of you, framed in the work-weeks and salaries it quietly consumes. Open the maths to see every step, switch currency, and download a branded one-page PDF or copy a link that reopens the exact scenario.
E/E Solution Tracker
A live, high-level board for one Program Increment of a scaled automotive E/E programme. The same delivery board, read four ways.
A board that shows where scaled work quietly fails
Most delivery tooling shows the work inside teams: the boards, the stories, the commitments. The dangerous part of a scaled programme is the boundary between teams, and the work that never made it onto a board at all. This tracker keeps the usual Capability, Feature and Story hierarchy, then lets you switch lenses to surface four failure modes that prose alone struggles to make tangible.
Fed by an illustrative dataset, not a live system. The tracker is built against the Atlassian Jira Cloud REST API and can read live Capabilities, Features, Stories, sprints and assignees from a production board. The current PI and sprint update automatically from today’s date. To see your own programme, open the demo and use Load your own board to drop in a JSON export.
Open the live board
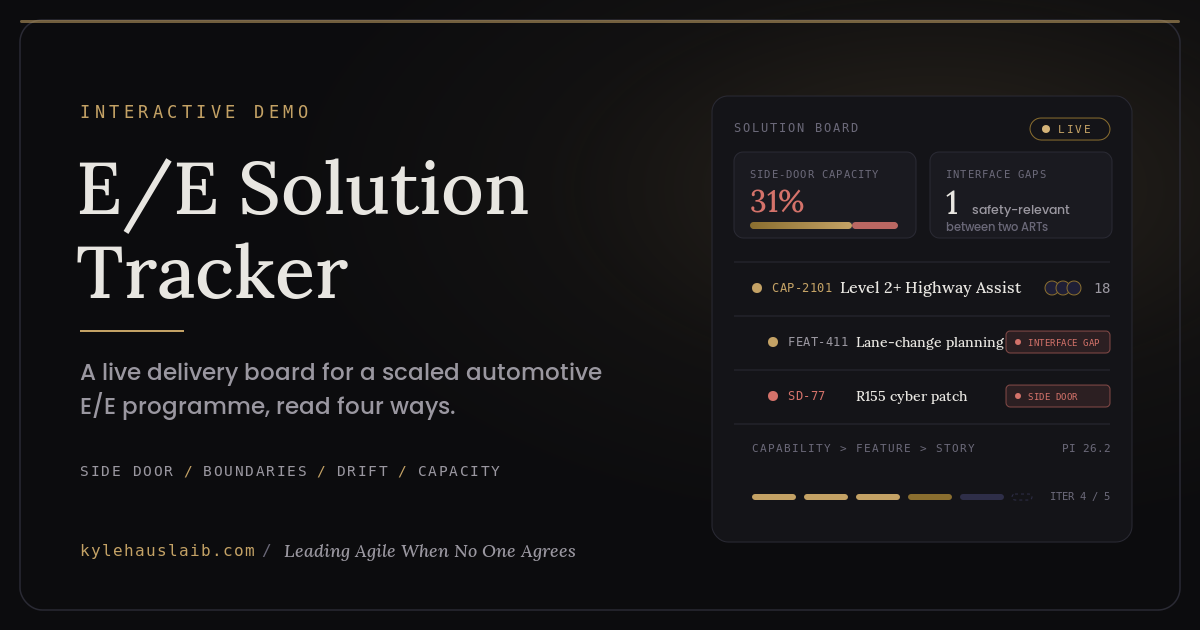
Four lenses, four ways delivery drifts
Each lens is a diagnostic from the Drift framework, applied to live delivery rather than to a workshop.
Unplanned intake
Work that bypassed PI Planning, flagged against the committed plan, with what it displaced and how many people it pulled in. The goal is not to shut the door, it is to see what it carries.
Dependencies and interface gaps
Links between teams, with interface gaps drawn in alert. The story is the implementation. The dependency is the interface. The boundary is where systems break.
Planned versus actual
The committed plan against what is actually being worked. Where they diverge is the drift: committed work that stalled, and active work nobody planned.
Over-allocation and hidden owners
People spread across too many items, committed work with nobody on it, and single-owner risk on safety-relevant stories. Both an empty name field and a single name are single points of failure.
DriftBoard Next
The same delivery board, reimagined as a cinematic, self-diagnosing view.
Drift you can watch, a board that diagnoses itself
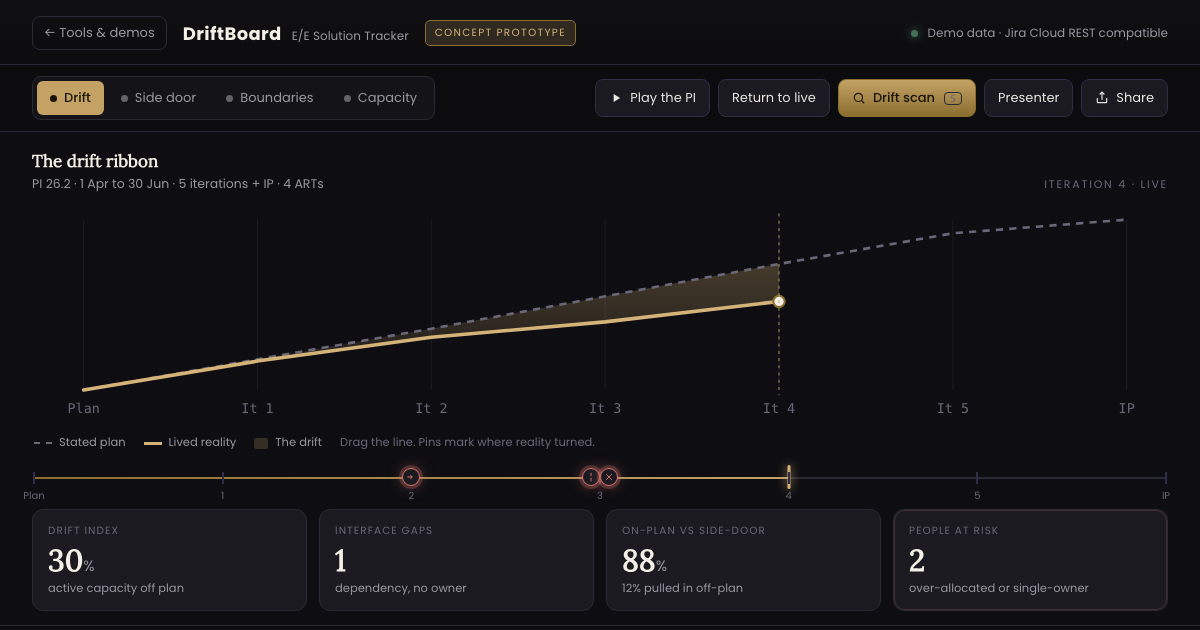
A drift ribbon you scrub from PI Planning to today, four lenses that morph the same board, a one-tap scan that names what is drifting and maps it to the five-question Drift Check, a living dependency constellation, and a presenter mode for the stage. A concept prototype on demo data.
PI Replay
One programme increment, narrated week by week. The numbers are invented; the pattern is not.
Watch the plan and the work part ways
Twelve weeks, two side doors, one corridor replan: an anonymised, composited PI stepped through on a DriftBoard, ending with what a leader can read from the gap. Step through at your own pace or let it play.
The Drift Check
The book's five-question diagnostic for the distance between what your organisation says it does and what it does in practice.
Rate five statements, on information, decisions, commitments, improvement and knowledge, and get your Drift reading. It runs entirely in your browser and stores nothing; the conversation about the gap matters more than the score. The same check ships as a printable worksheet and as drift-cli for the terminal, kept local by design: a score that gets reported upward stops measuring the gap and starts producing it.
Where this comes from
The lenses are the diagnostics from the Drift framework, the spine of my book Leading Agile When No One Agrees. These tools make the framework tangible: the same questions a leader should be able to ask of a live programme. Want this read on your own delivery, or a version that loads your own board? That is the work I do.